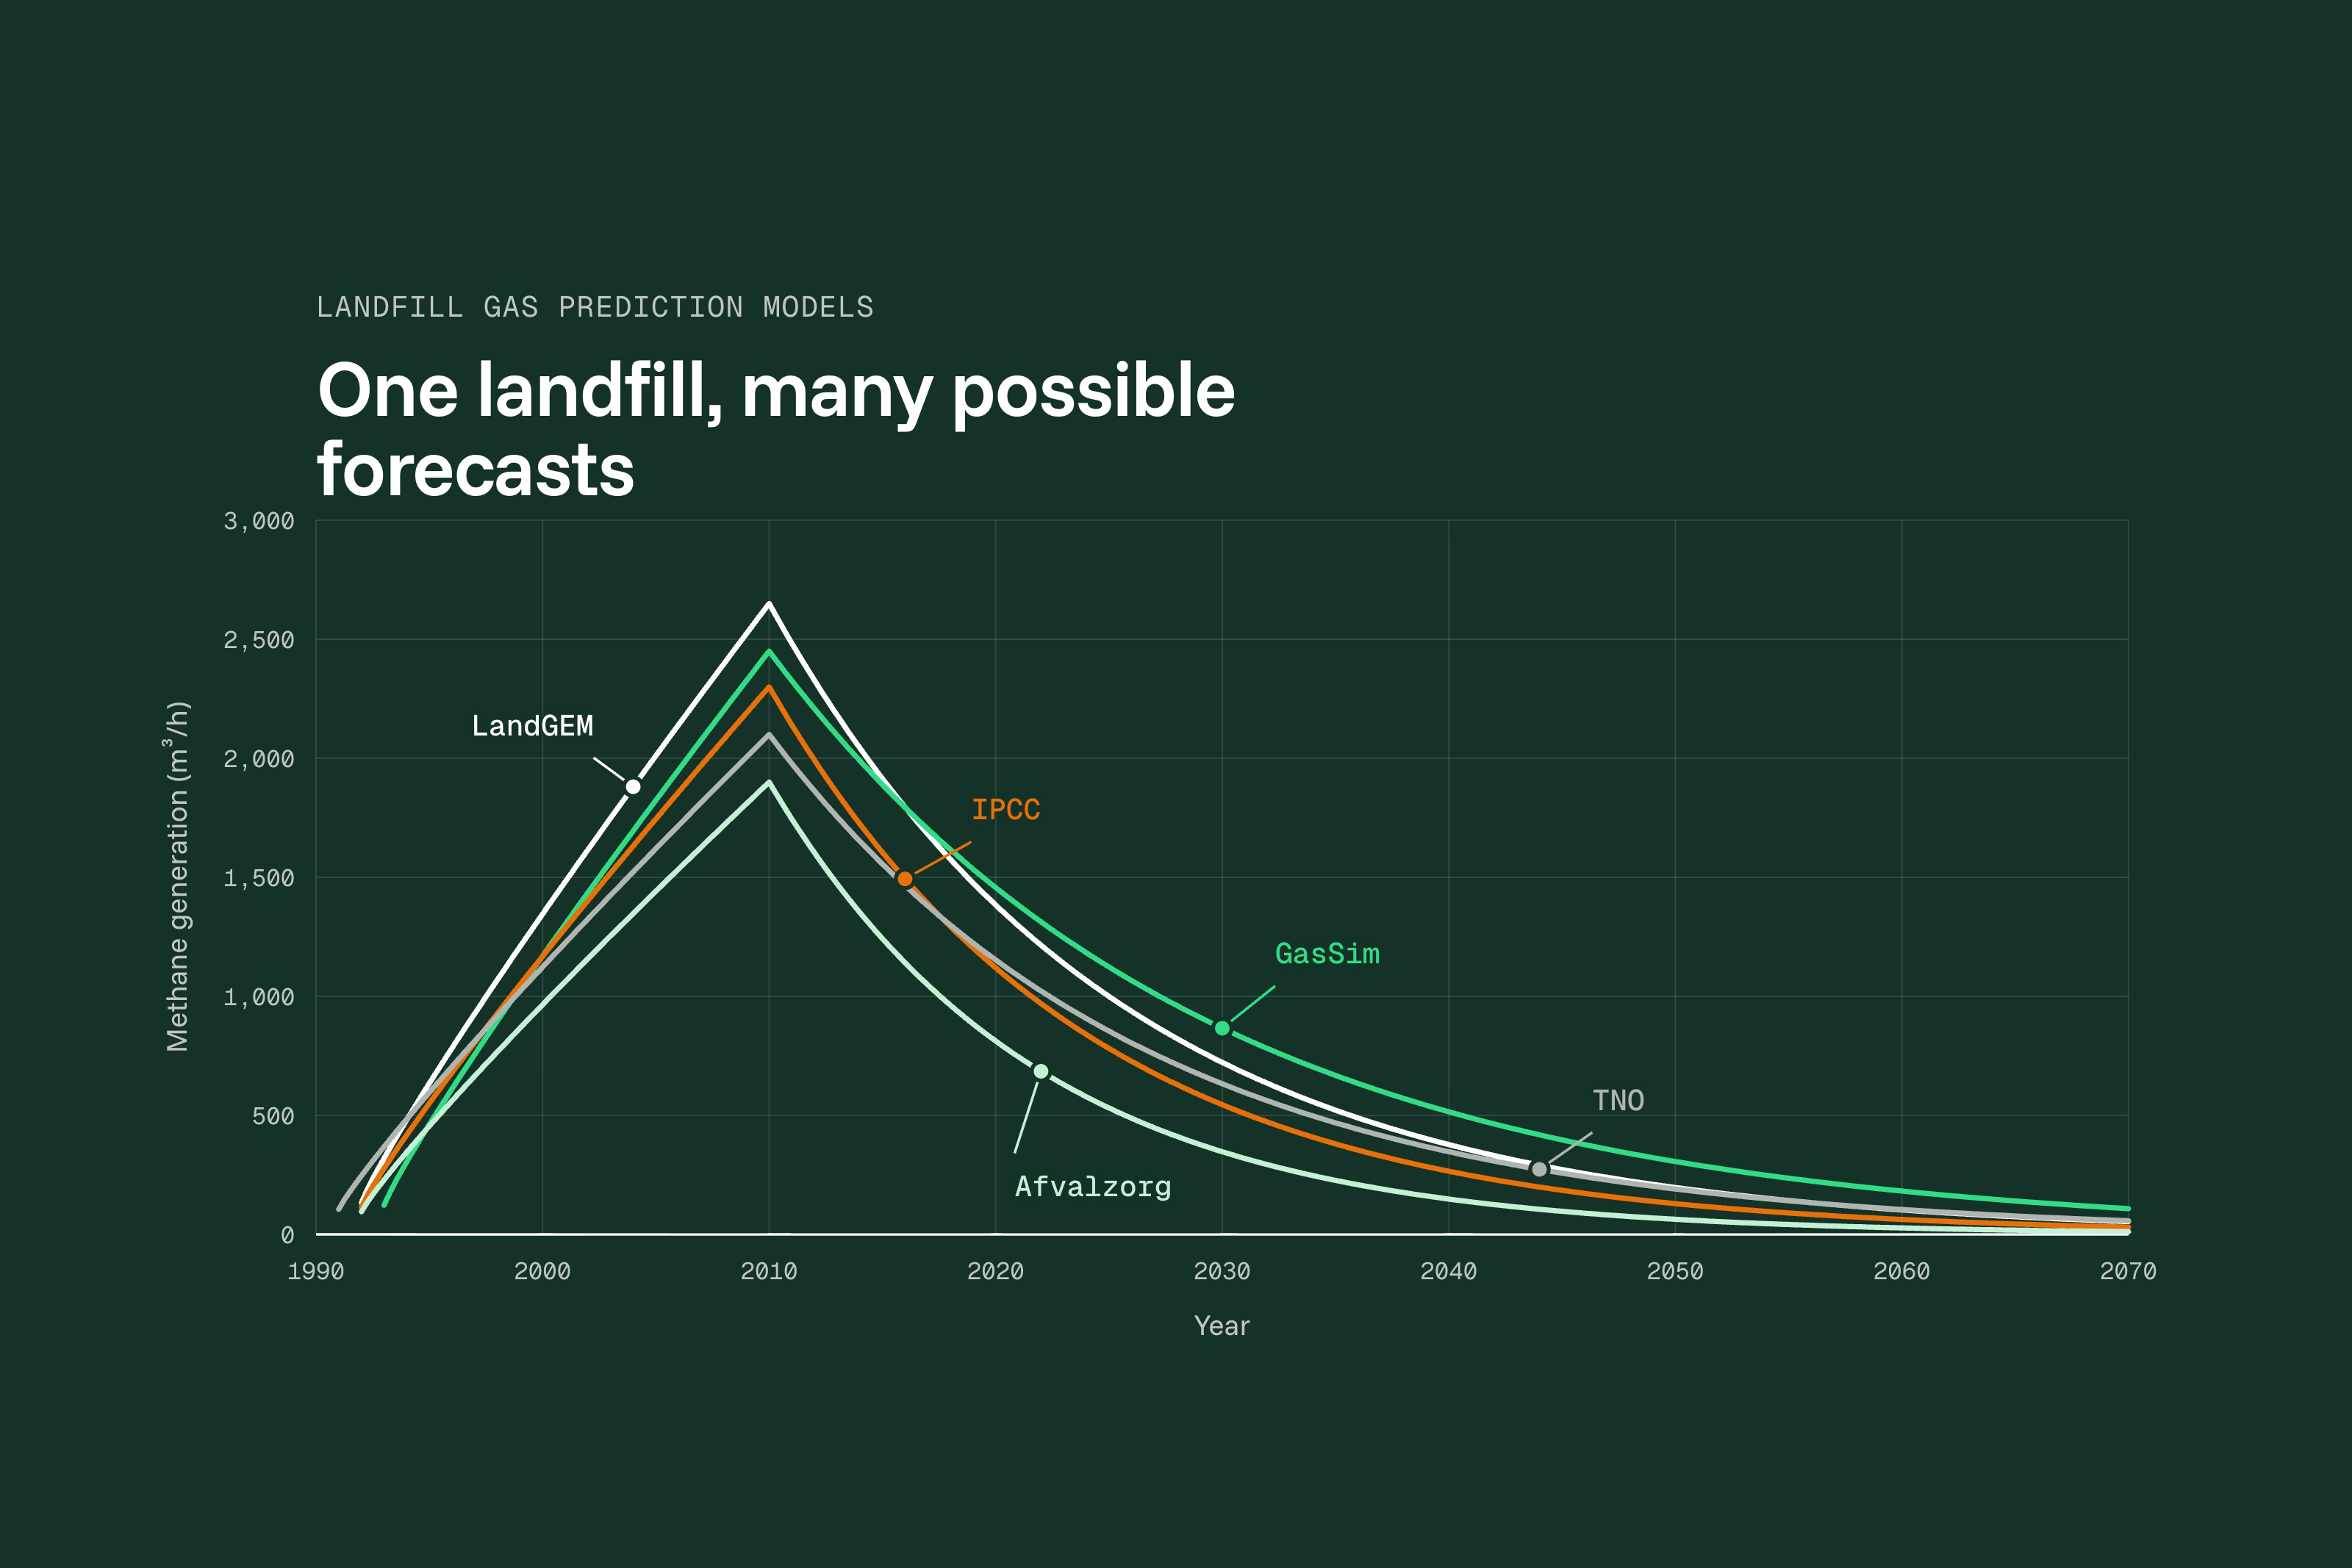
When researchers ran several landfill gas models on the same Dutch landfill, one forecast came out at nearly six times what was really measured1.
A landfill gas model estimates how much methane a landfill will generate each year for decades ahead. It works from three inputs: how much waste went in each year, what that waste is made of, and the local climate. Nobody can see inside a landfill, so the model is often the only way to know how much gas it holds and when it will come out2.
That forecast matters from day one.
- Regulators require larger landfills to report their methane emissions. That figure starts from a modelled estimate of how much methane the waste generates1,3.
- Before a gas system is built, the model decides whether the gas can pay for an engine or upgrading plant. It also sets the size of the wells, pipes, blowers and flares. When it is wrong, projects get built for gas that never arrives2,4.
- Once the system runs, the model becomes the benchmark. Landfill engineers compare the gas they collect with the model's curve. A large shortfall points to trouble in the field: poorly tuned wells, a damaged cover or liquid blocking the wells.
This article explains how five widely referenced models work, where each goes wrong and why the data you feed a model matters more than which one you pick.
The two numbers behind every model
Almost every model comes down to two numbers.
- L0: how much methane the waste can make. The total methane one tonne of waste will generate over its life, in cubic metres per tonne. Food, paper and garden waste push it up; soil, rubble and plastic add almost nothing. It sets the size of the resource.
- k: how fast the methane comes out. The decay rate of the waste, easiest to read as a half-life: the years until half the methane has come out. Wet, warm waste decays faster, so it has a higher k. Together with L0, k sets how high generation peaks and how fast it falls5,6.
Every model has default values for both numbers, meant for sites with no data of their own. This article calls them standard values and they turn out to be where most forecasts go wrong.
First-order decay: the industry standard
The two numbers meet in one formula. Every model in this article uses first-order decay: each year, a fixed share of the remaining organic waste decays. A year's waste starts generating methane straight away, then generates a little less every year as the material runs out2.
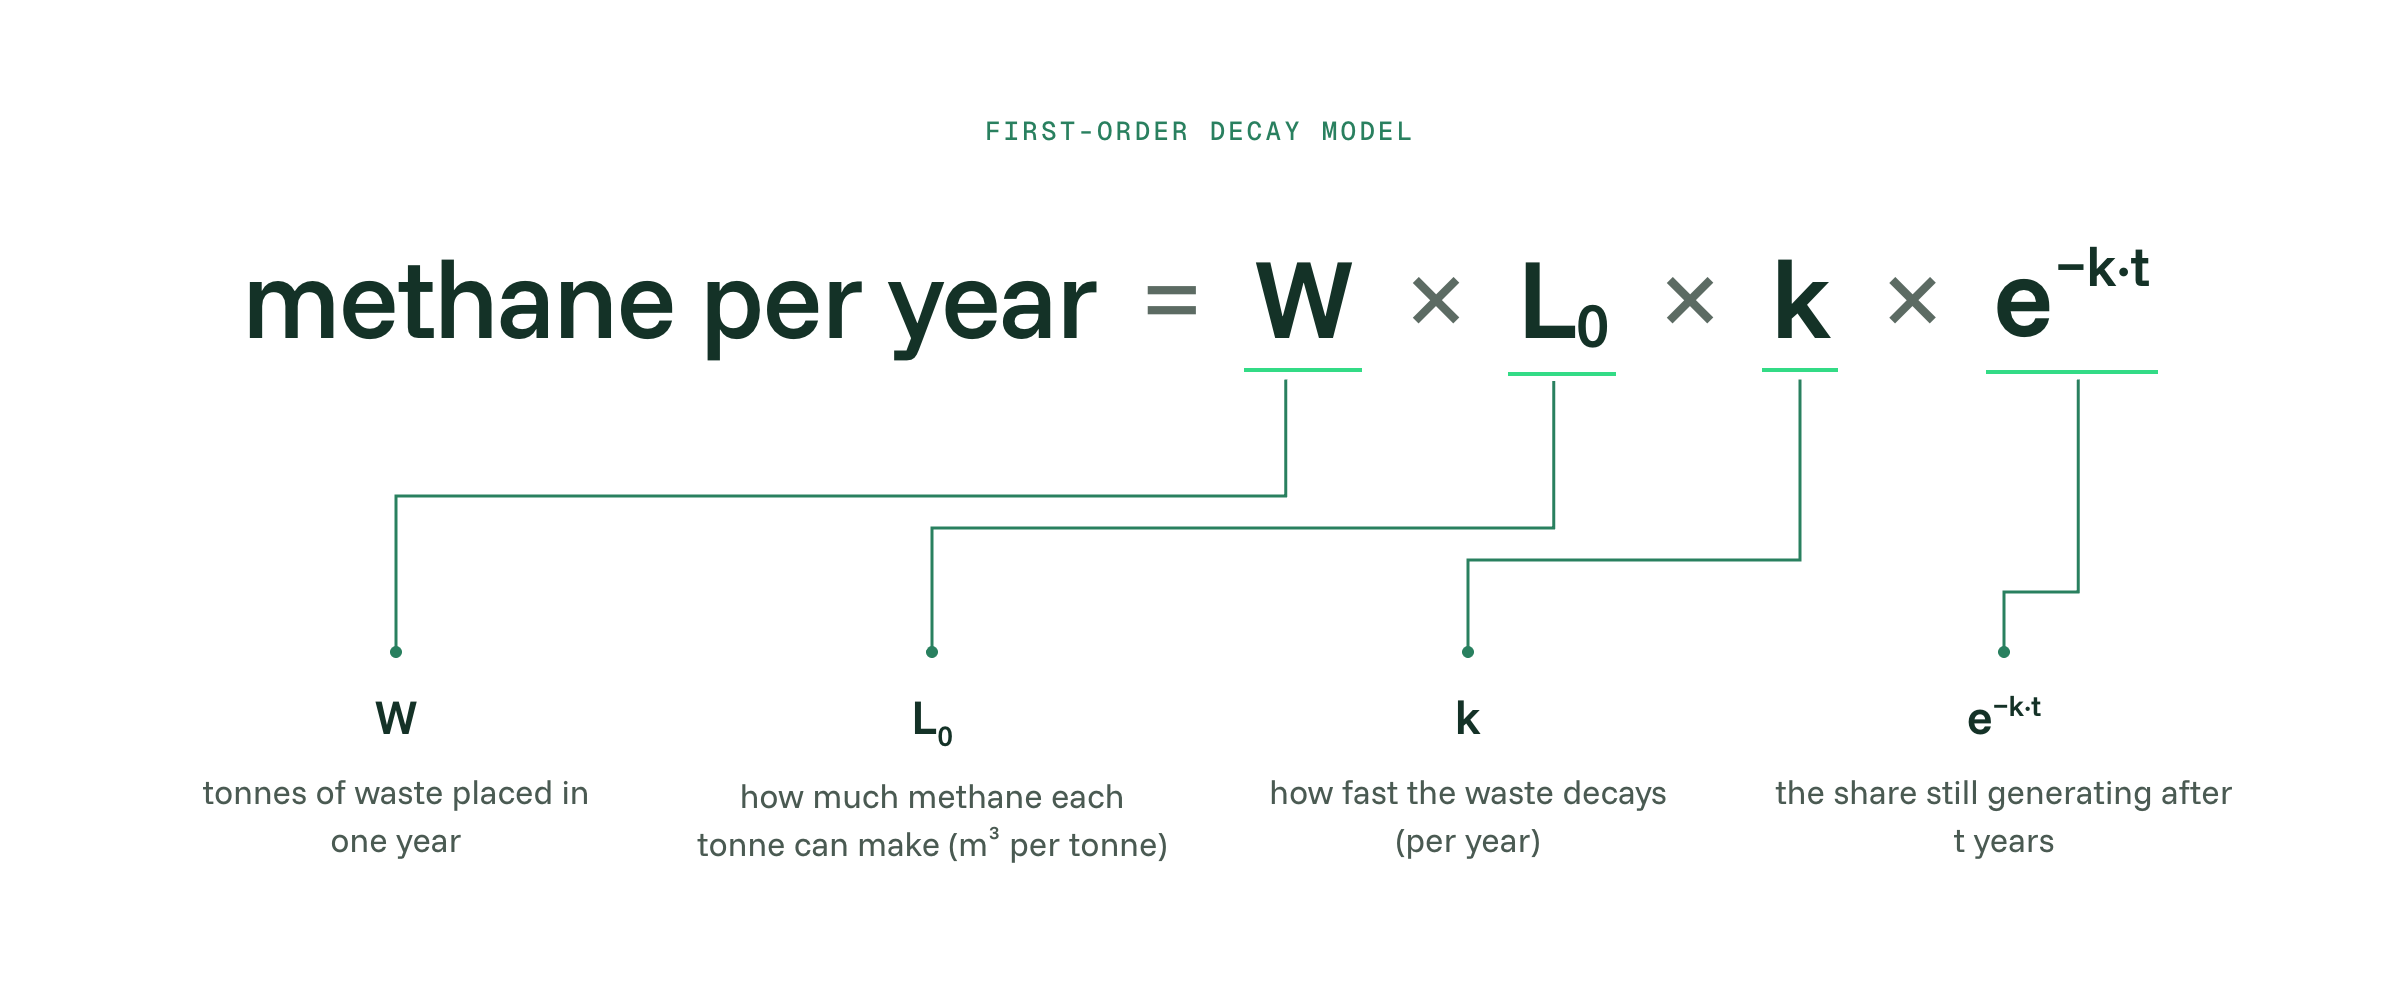
W is the tonnes of waste placed in one year, and t is the years since it was placed. Landfill gas is roughly half methane, so total gas volume is about double. For the full equation, see the Global Methane Initiative's guide to landfill gas modelling.
Two types of first-order decay models
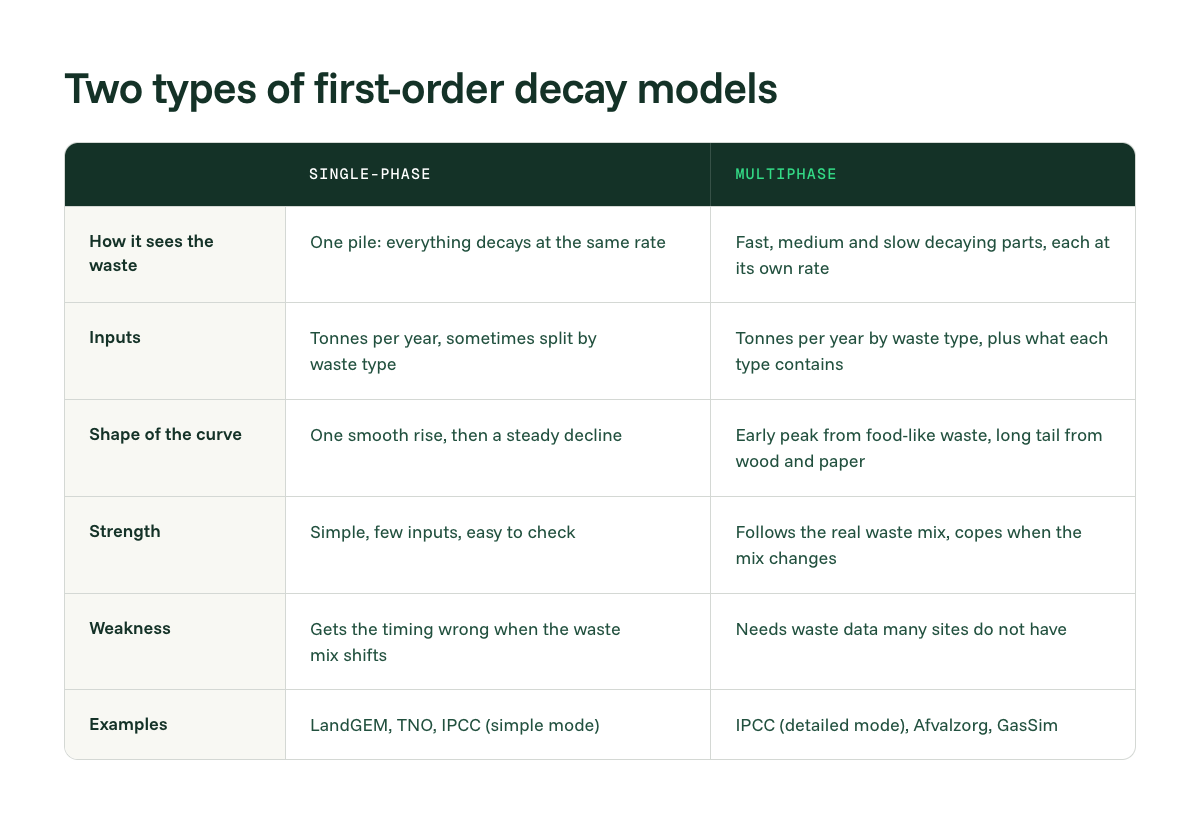
Where models differ is in how often they apply the formula. Some run it once, treating all the waste as one pile with one decay rate. Others split the waste into fast, medium and slow decaying material, run the formula for each and add the results. That single choice splits the models into two families.
Five models, one by one
Within each type sit several models in regular use. What changes is the inputs: which waste types the model accepts, and the standard values for how much methane each type makes and how fast it decays. Some add extras, like climate adjustments or uncertainty ranges.
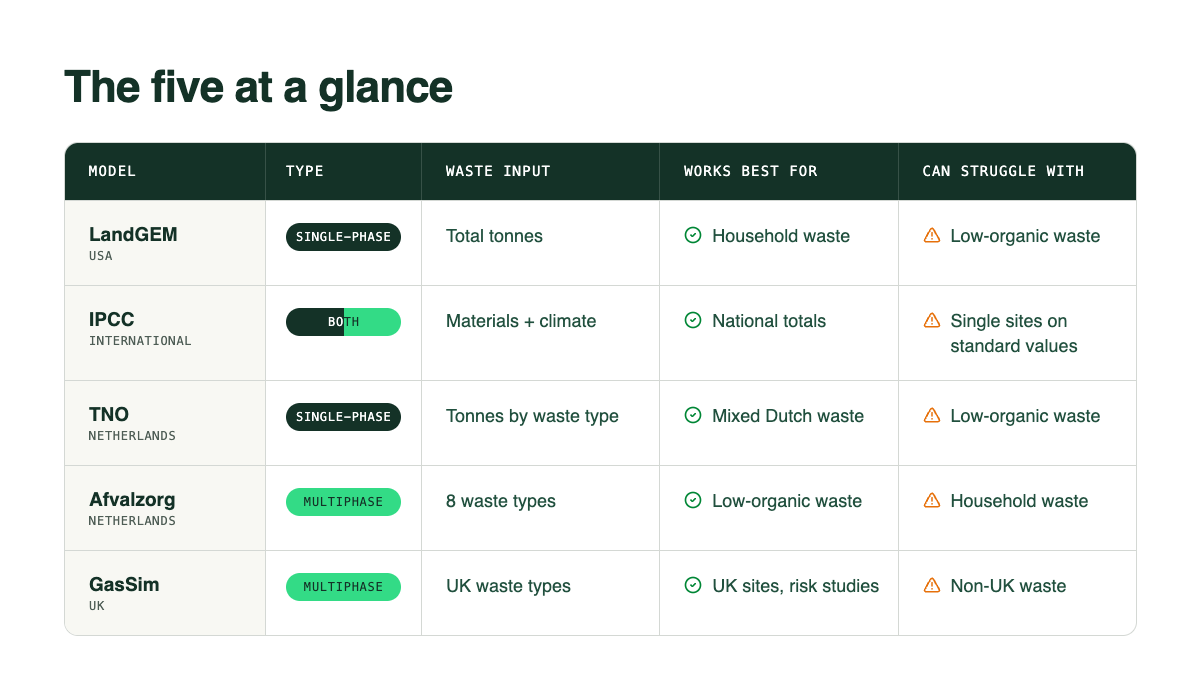
LandGEM and IPCC are the two global standards. The other three are European models built around national waste data. Each bets on the waste in a different way, and field tests show where each bet pays off.
LandGEM (US EPA)
The US EPA's Landfill Gas Emissions Model (single-phase) is the most widely used landfill gas model in the world: a free Excel tool and the basis for US regulation. It is also the simplest. The only waste input is total tonnes per year, and every tonne is assumed to generate the same amount of methane5.
- Works well: landfills full of household waste. At the most household-waste-heavy site in the Dutch study, it came closest of all models to the measured emissions1.
- Goes wrong: sites with lots of soil, rubble or commercial waste. It treats every tonne as household waste and overestimates, sometimes several times over. Its standard values can also miss the other way: at some wetter North American sites it came out too low7,8.
IPCC first-order decay (international)
The IPCC model is the international standard for national greenhouse gas reporting and carbon credit projects2. Unlike LandGEM, it asks what is in the waste (food, paper, wood, textiles) and adjusts each material's decay rate for the climate. It also corrects for site management: a covered, compacted landfill generates more methane than an open dump, because less oxygen gets in. It can run with one decay rate for all waste (single-phase) or one per material (multiphase).
- Works well: estimating a whole country's emissions, where errors at individual sites cancel each other out. Its waste categories and climate zones also make it a better starting point than LandGEM for most countries1.
- Goes wrong: single sites run on standard values. It overestimated at low-organic Danish landfills. In Canada, an IPCC-based national model came out about three times too high on average, and up to 13 times in cold, dry regions7,9.
TNO (Netherlands)
The Dutch government uses TNO's model (single-phase) for national methane reporting. It was the first model built on real gas data from a group of landfills6. The user enters how many tonnes of each waste type went in each year: household, commercial, soil, and so on. The model knows the carbon content of each type and assumes just over half of that carbon (58%) ever turns into landfill gas1.
- Works well: mixed Dutch-style waste in a wet climate. It is the most thoroughly tested of the five, built on gas data from 9 landfills and checked against measurements at 256.
- Goes wrong: sites with little organic waste, where it came out higher than the measurements because it treats all carbon as decaying at one rate. Its standard values are also getting dated1.
Afvalzorg (Netherlands)
Dutch landfill company NV Afvalzorg built its own model (multiphase) for sites with little household waste6. It takes tonnes per year across eight waste categories, from household waste to contaminated soil. Each category is split into fast, medium and slow decaying material. Instead of one number, it gives a low and a high estimate of methane generation1.
- Works well: sites with little household waste, such as soil, rubble and commercial waste. Adjusted to local waste, it matched measurements at Danish and Dutch landfills7.
- Goes wrong: household-waste sites, where it tends to come out too low, as it did at a Mexican landfill. It also needs detailed waste data that many sites do not have10.
GasSim (UK Environment Agency)
GasSim is the UK regulator's preferred model (multiphase), built by Golder Associates (now WSP). It covers more than gas generation: emissions, gas migration and risk as well11. Like Afvalzorg, it splits waste into fast, medium and slow decaying material, but with UK waste categories. The user also sets how wet the site is, since wetter waste decays faster. It then runs the calculation hundreds of times with slightly different inputs, which gives a range of likely outcomes rather than one number1.
- Works well: UK sites and household waste in north-west Europe, where its results are in line with the most tested models6.
- Goes wrong: waste from outside the UK. It could not represent Dutch waste types and gave the highest estimate of all models at a commercial-waste site. It is also a closed program that is hard to check and needs an expert user1.
What the field tests show
Models predict the gas the waste generates, but researchers can only measure what the wells collect or what escapes through the cover, so every test compares the model against one of those. They have run such tests many times, in the Netherlands, Denmark, Canada, Mexico and the US. The details differ from study to study. The conclusions line up.
- The perfect model does not exist. The same model can be the closest at one site and the furthest off at the next. In the Dutch study, LandGEM was the least accurate model at one landfill and the most accurate at another1.
- Standard values are often far off. When a forecast relied on the model's standard values for L0 and k alone, it was often several times too high or too low9.
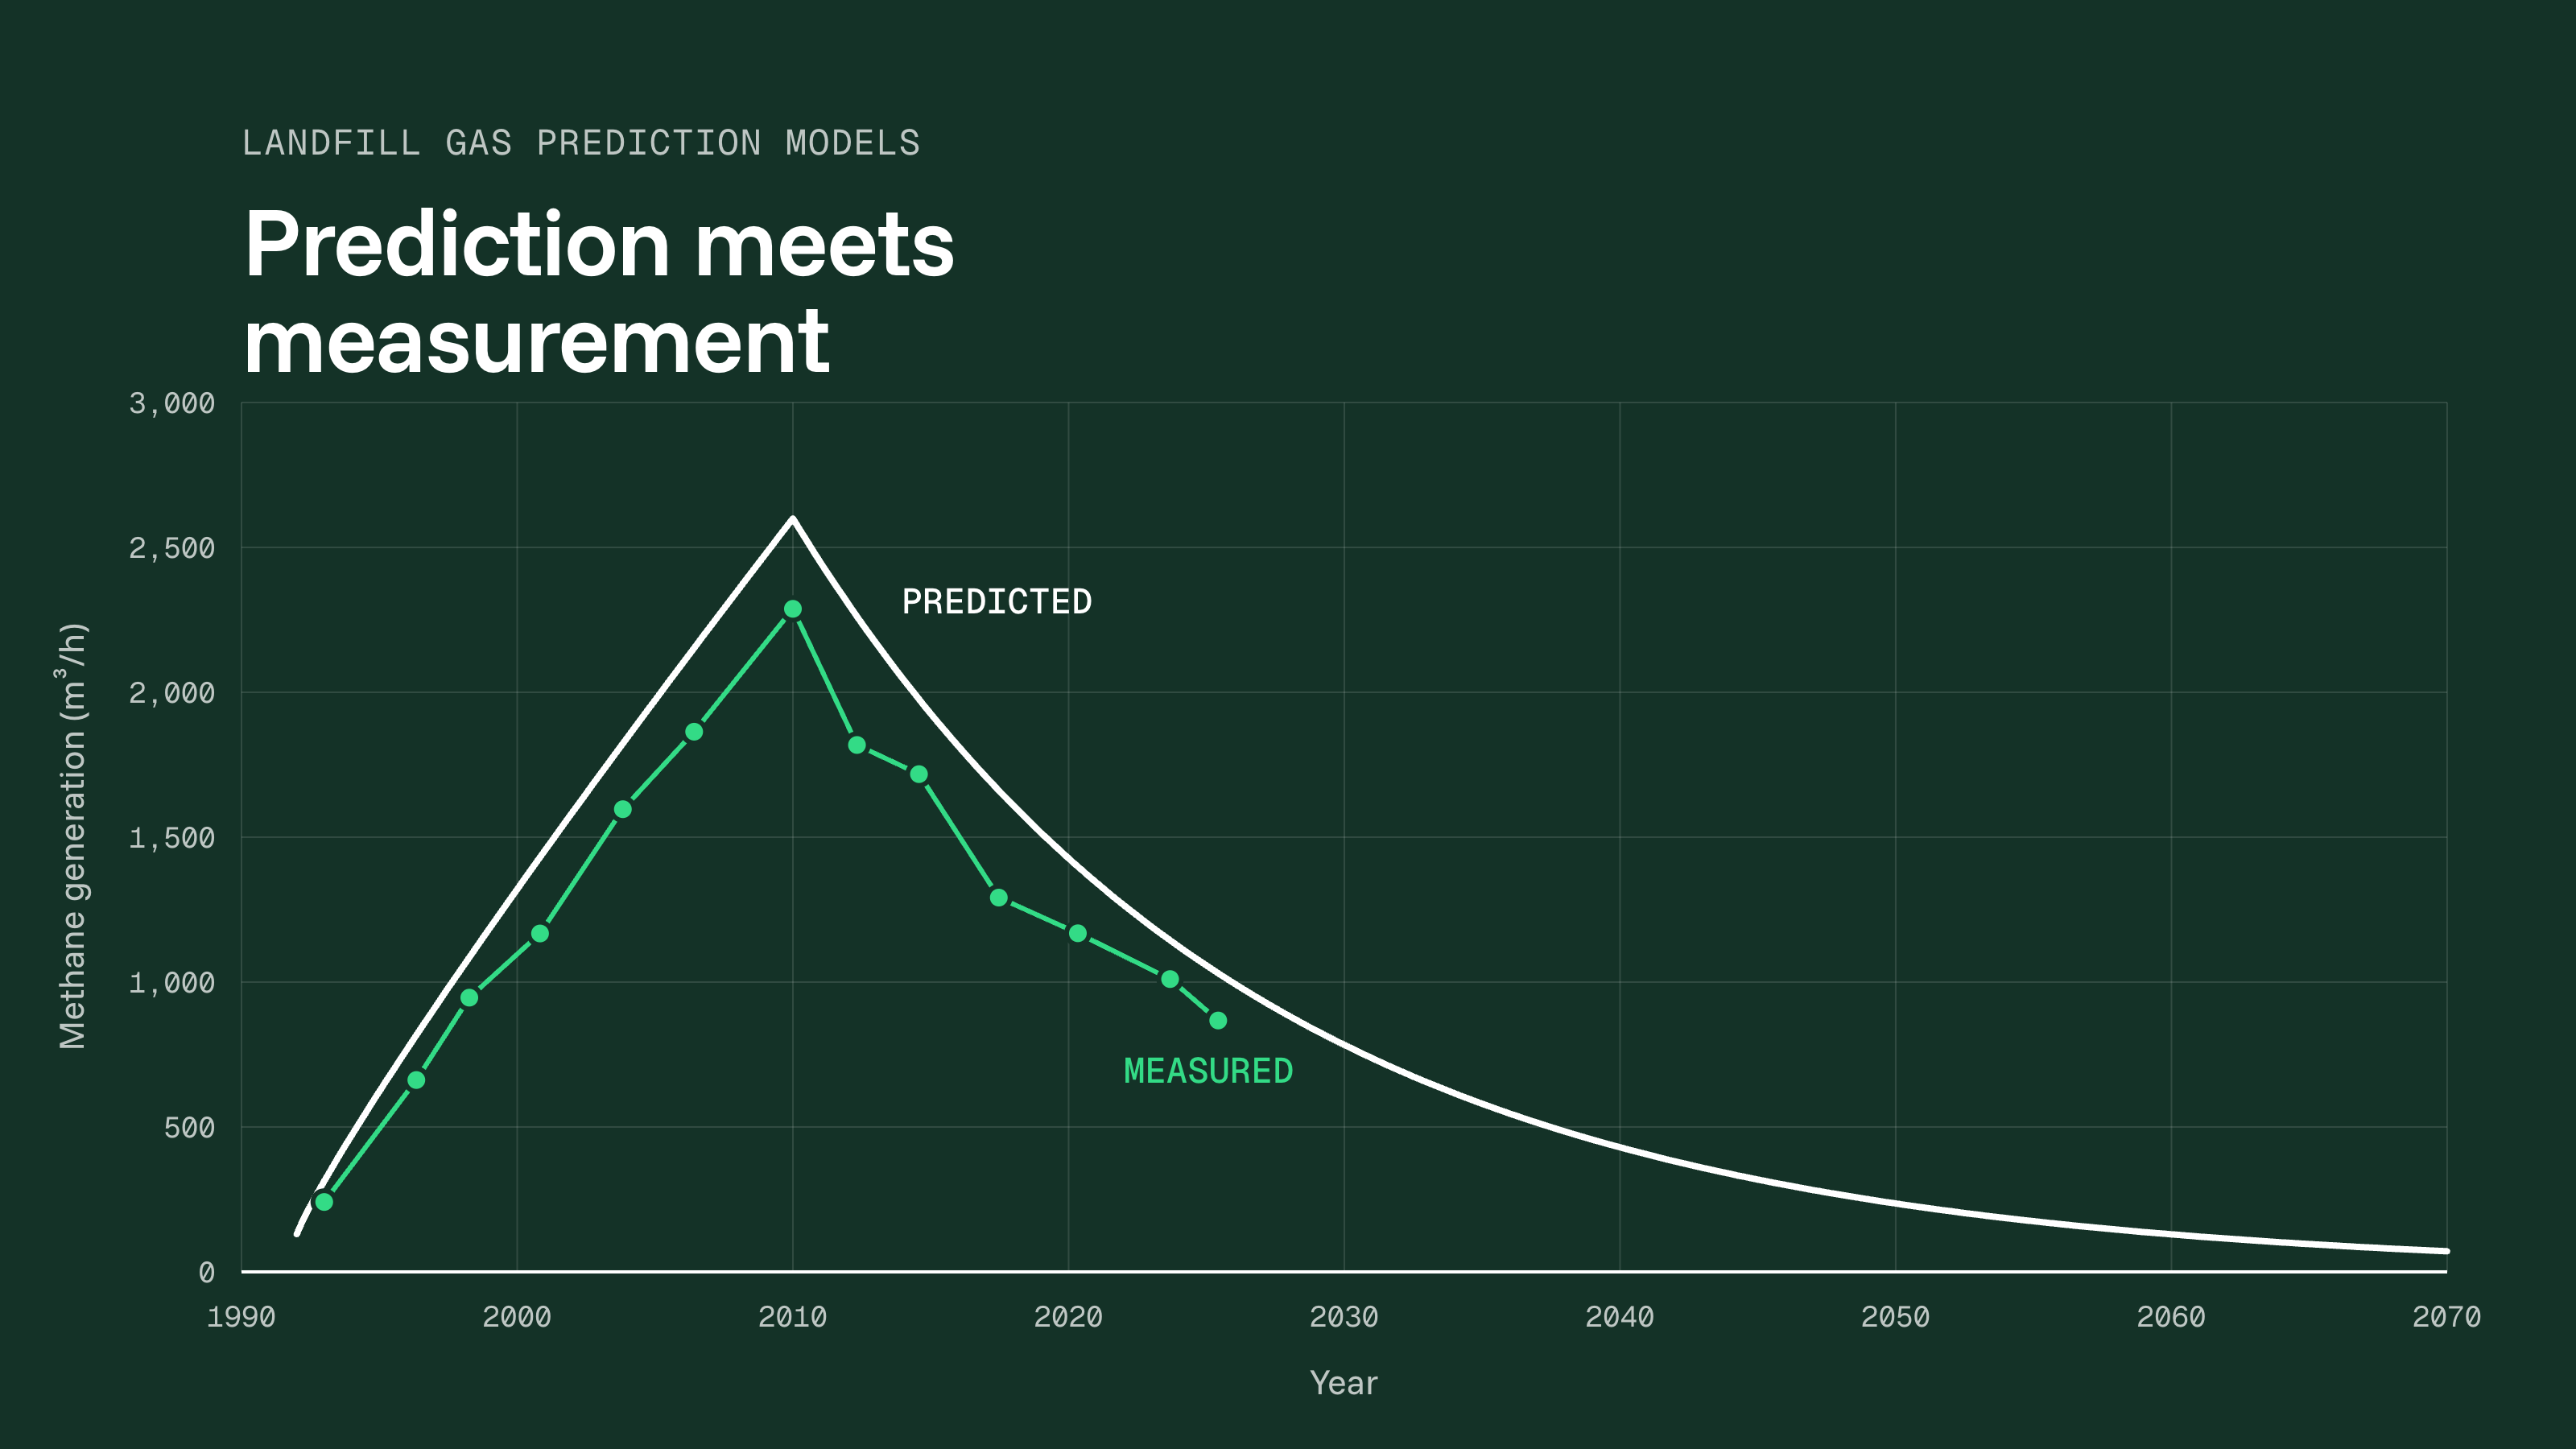
- Calibration beats sophistication. Calibration means adjusting L0 and k until the model matches what is actually measured at the site. In the Dutch and Danish studies, the models that came closest had been adjusted to that site's waste or measurements. In the US, a simple single-phase model fitted to each site's own gas data stayed within 20% of field measurements7,12. Compare that with the sixfold miss at the start of this article.
What makes a forecast trustworthy
You cannot measure the future, but you can measure today. The models disagreed because of their two numbers, L0 and k. The best forecast uses a site's past and current gas data to correct those two numbers, then lets the corrected model project forward.
In practice, a trustworthy forecast comes down to three habits:
- Pick a model that fits the waste. Choose one whose waste types match what the site actually received, or a multiphase model if the mix has changed over the years.
- Calibrate on site data, and keep calibrating. Correct L0 and k with measured gas data, and correct them again every year as new data comes in.
- Report a range, not a number. Treat the output as an estimate with a low and a high case, as Afvalzorg and GasSim do, and plan for both ends2,6.
The data you feed the model matters more than the model itself.
Where Hydryx comes in
At most landfills, gas data is only collected when landfill engineers walk the field and measure the wellheads by hand, typically weekly or monthly. Both the forecast and the wellfield are run on snapshots.
Hydryx measures gas quality at every wellhead every 15 minutes and adjusts each valve in response, collecting more gas through infrastructure the site already has. Across live sites in three countries, that means more than 30% green energy uplift.
For modelling, this is the site data the article keeps coming back to: a continuous, well-by-well record that replaces standard values. Landfill engineers see a well falling behind when it happens, not at the next round.
Ready to learn what continuous data would show at your site? Let's hop on a call and we can run through the numbers.
Sources
- Scharff & Jacobs (2006). Applying guidance for methane emission estimation for landfills. Waste Management 26(4).
- Global Methane Initiative (2012). International Best Practices Guide for LFG Energy Projects, Ch. 6: Landfill Gas Modeling.
- Irish EPA. E-PRTR supporting document for landfills.
- BC Ministry of Environment. Landfill gas management facilities design guidelines.
- US EPA LMOP. LFG Energy Project Development Handbook, Ch. 2: Landfill Gas Modeling.
- Oonk (2010). Literature review: methane from landfills. Sustainable Landfill Foundation.
- Mou, Scheutz & Kjeldsen (2015). Evaluation and application of site-specific data to revise the first-order decay model for Danish landfills. Journal of the Air & Waste Management Association.
- Thompson et al. (2009). Building a better methane generation model: 35 Canadian landfills. Waste Management 29.
- Stuart et al. (2025). Canada's landfill methane inventories. Elementa.
- Colomer Mendoza et al. (2016). Gaseous emissions of a sanitary landfill in Mexico.
- WSP. Environment Agency toolkits: GasSim.
- Amini, Reinhart & Niskanen (2013). Comparison of first-order-decay modeled and actual field measured MSW landfill methane data. Waste Management 33(12).